explain “Liquidity”

1. Where is the Liquidity?
To spot liquidity, you need to know which trend the market is following.
In a downtrend = Liquidity is found on the UPPER SIDE of the chartIn a uptrend = Liquidity is found on the LOWER SIDE of the chart

1.1 Where is the Liquidity?
Liquidity rests at previous Highs in a downtrend.
On HTF, Liquidity points will be at PDL, PDH, PWL and PWH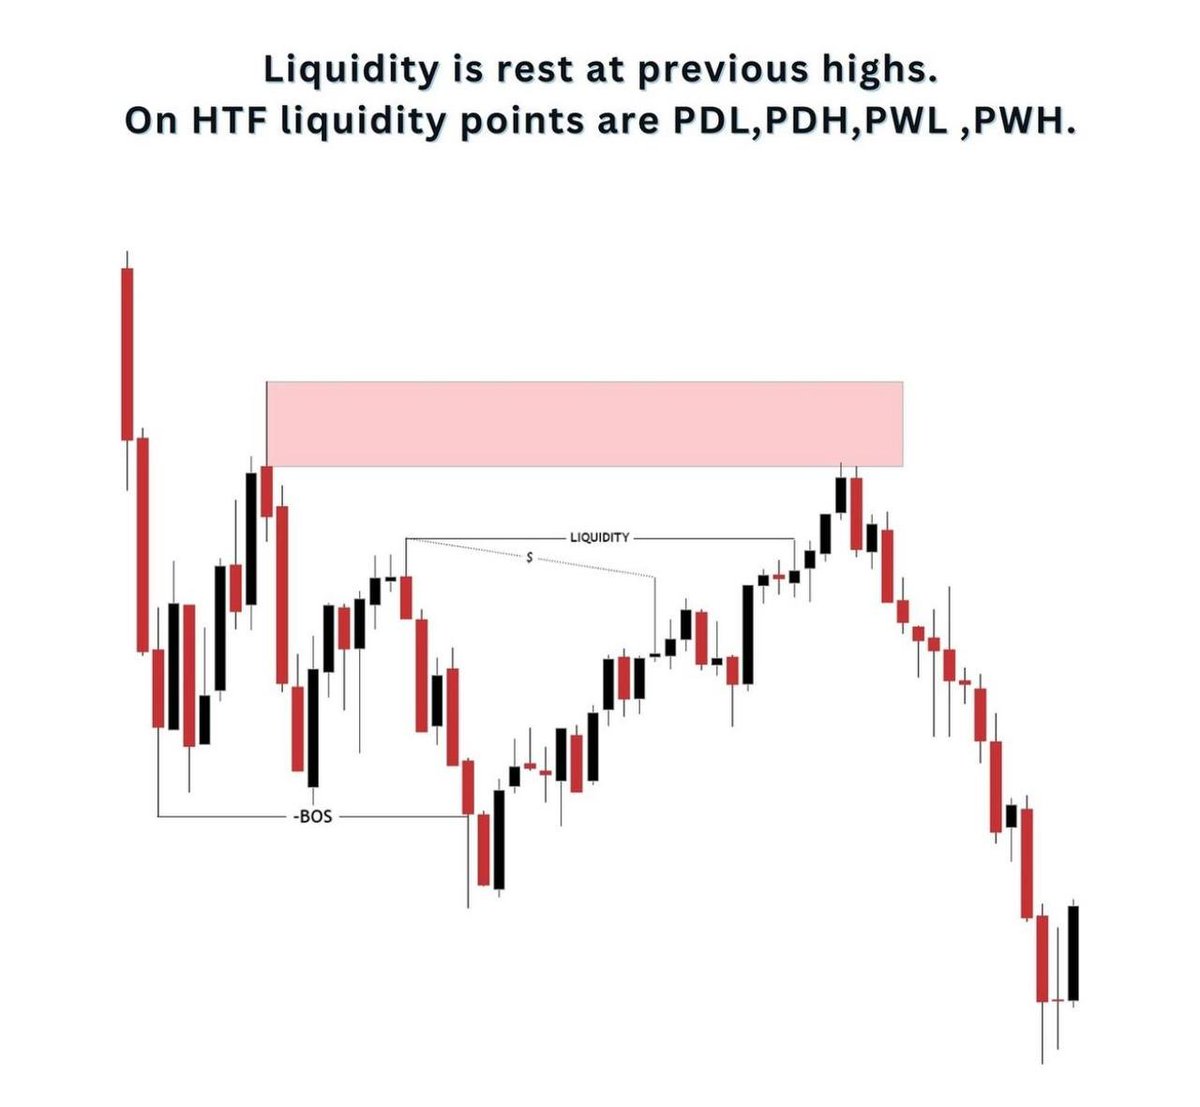
Liquidity rests at previous Highs in a downtrend.
On HTF, Liquidity points will be at PDL, PDH, PWL and PWH
1.2 Where is the Liquidity?
After a strong selling or buying level is formed, Liquidity will build accumulation around those areas.
When a sweep in the price occurs, it targets the supply or demand zones, to provide the necessary Liquidity for the next move.
After a strong selling or buying level is formed, Liquidity will build accumulation around those areas.
When a sweep in the price occurs, it targets the supply or demand zones, to provide the necessary Liquidity for the next move.
2. Liquidity Sweep
A liquidity sweep occurs when significant market players execute large-volume trades to trigger the activation of a cluster of pending buy or sell orders
This action typically results in rapid price movements and targets what are known as liquidity zones.
A liquidity sweep occurs when significant market players execute large-volume trades to trigger the activation of a cluster of pending buy or sell orders
This action typically results in rapid price movements and targets what are known as liquidity zones.
2.1 Shift with Displacement
A Shift indicates a potential reversal in market trends, marked initially by a Lower High in an uptrend or a Higher Low in a downtrend, followed by a displacement
A significant price movement that decisively breaks through a key market level
A Shift indicates a potential reversal in market trends, marked initially by a Lower High in an uptrend or a Higher Low in a downtrend, followed by a displacement
A significant price movement that decisively breaks through a key market level
2.2 How to identify "Sweep" and "Shift"
As you can see in the chart, when the price "Sweeps" the trend doesn't continue, is just a "Sweep on Liquidity"
Meanwhile, in a "Shift" price takes the Liquidity and changes trend.
As you can see in the chart, when the price "Sweeps" the trend doesn't continue, is just a "Sweep on Liquidity"
Meanwhile, in a "Shift" price takes the Liquidity and changes trend.
3. Types of Liquidity
This are some of the commons type of Liquidity.
- Trendline
- Equal Highs
- Asian Range
This are some of the commons type of Liquidity.
- Trendline
- Equal Highs
- Asian Range
3.1 Types of Liquidity
Equal Highs and lows: They are a bast area of Liquidity.
Many of the retail traders use this areas to place pending orders, following retail patterns.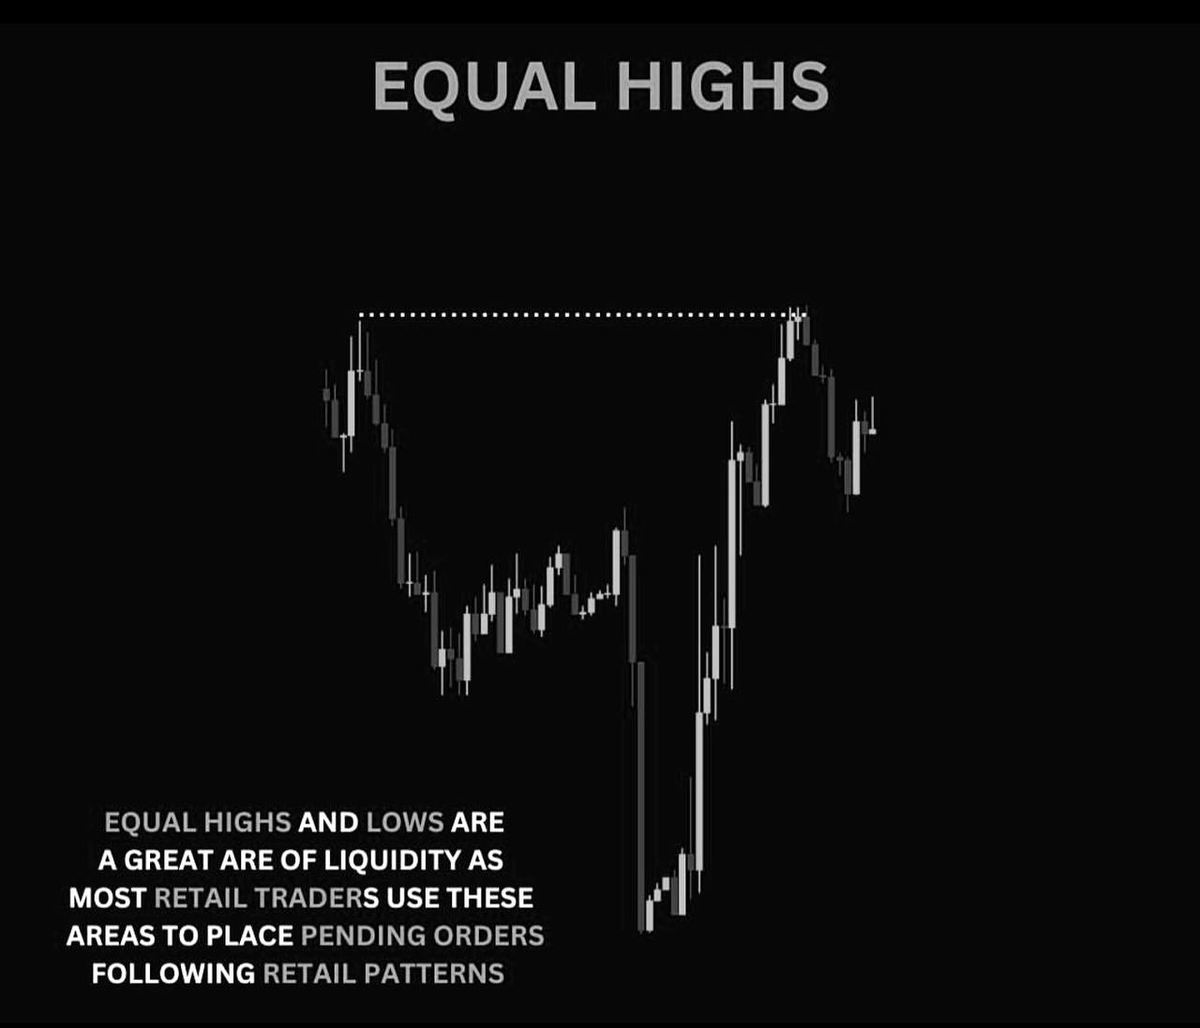
Equal Highs and lows: They are a bast area of Liquidity.
Many of the retail traders use this areas to place pending orders, following retail patterns.
3.2 Types of Liquidity
Trendline:
When the retest is more than 3 times, expect it to be a sweep of that trendline.
When price retests the trendline several times, is because theres abundance of orders over that area.

Trendline:
When the retest is more than 3 times, expect it to be a sweep of that trendline.
When price retests the trendline several times, is because theres abundance of orders over that area.

Tip of Oder block  Liquidity > Fvg > OB .
Liquidity > Fvg > OB .
Comments
Post a Comment